Visualization of Points and Trajectories#
Options for the visualization of points and trajectories are included in the tracking tab.
Tip
If you want to use PeTrack visualizations in your publication export the view of PeTrack instead of taking a screenshot. This will result in a higher-quality image. See here for more info.
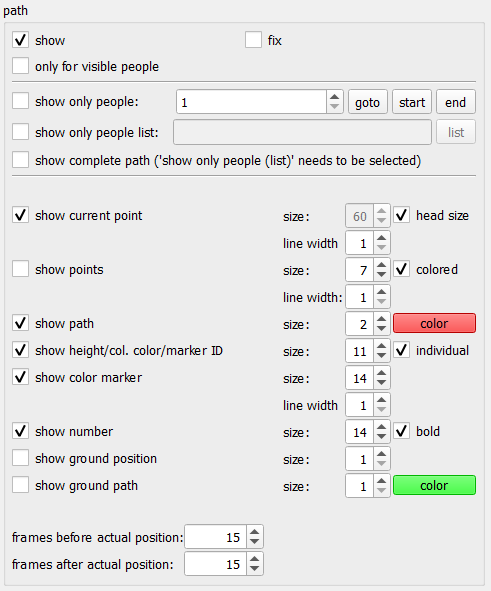
Options#
- show
Enables or disabled all of the following visualizations
Trajectory visualizations#
Trajectory visualizations are visualizations that show not only information about the current point, but also about the future and past trajectory.
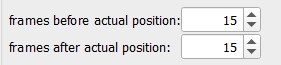
- frames before/after actual position
These two spin-boxes allow to select how many frames into the future and past all different trajectory visualizations are supposed to be drawn.
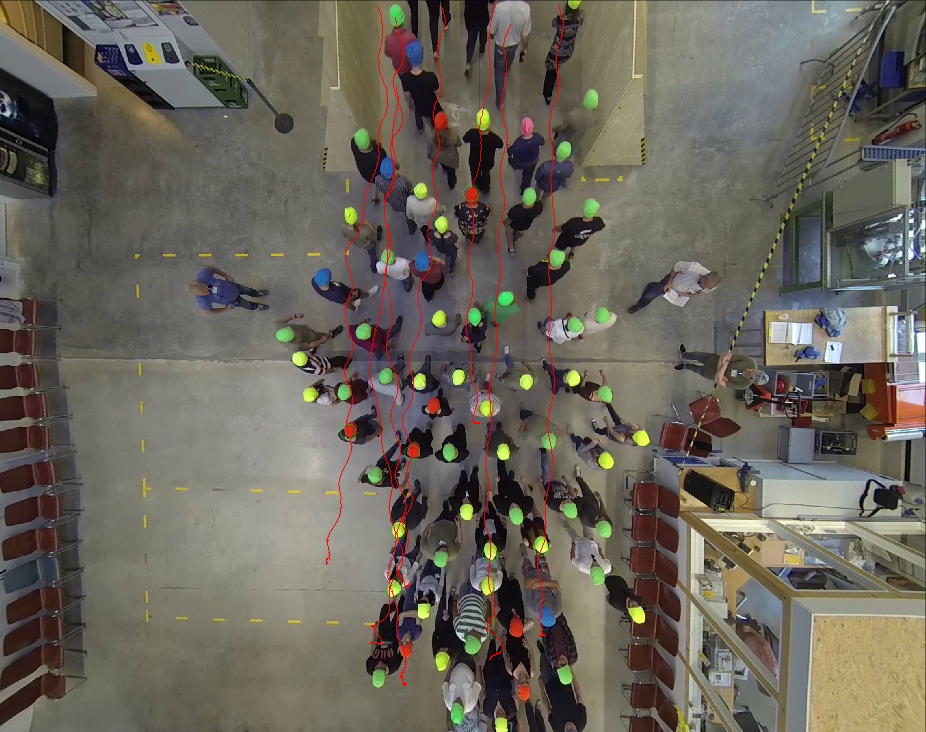
- show path
Shows the trajectory as a line. Note that during the first playback, only the past trajectory is drawn, since the future has not been tracked yet
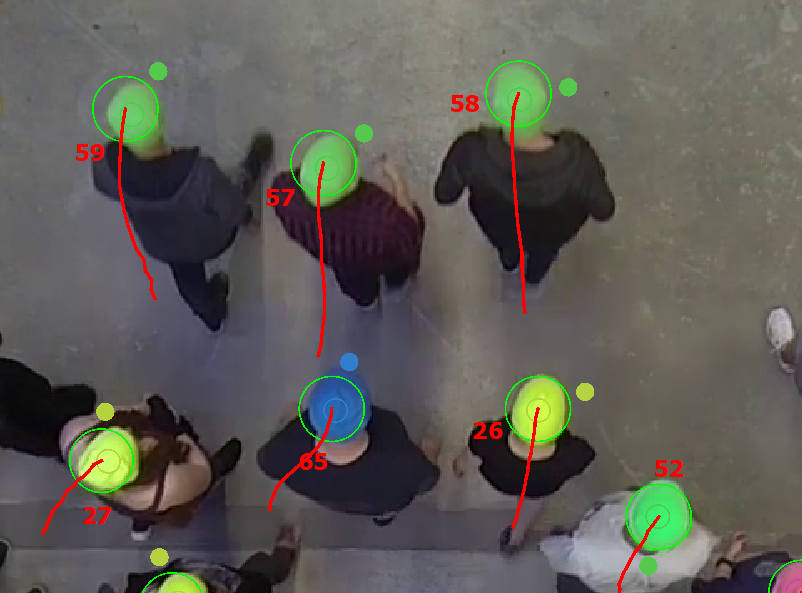
After tracking the whole video, the trajectory will be drawn in both, past and future directions
- show ground path
The head position can be projected down to the ground. This options draws the trajectory of this projection to the ground.

- show points
Shows the detected points.
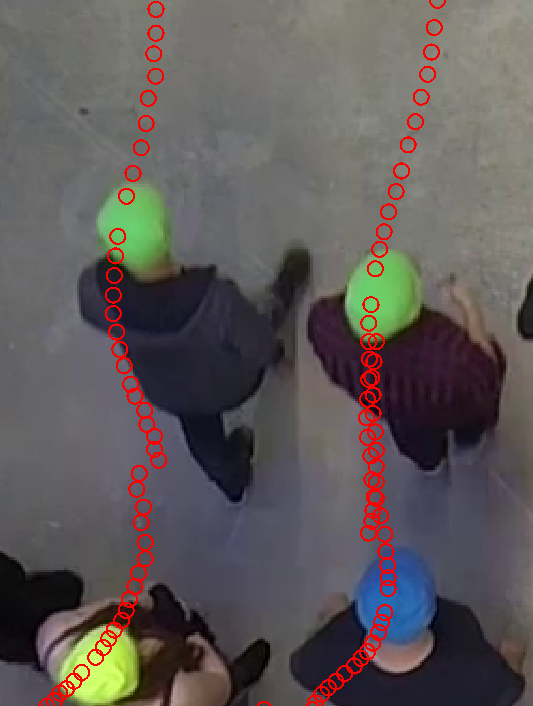
If the
coloredcheckbox is checked, the color of the TrackPoint is used to fill it out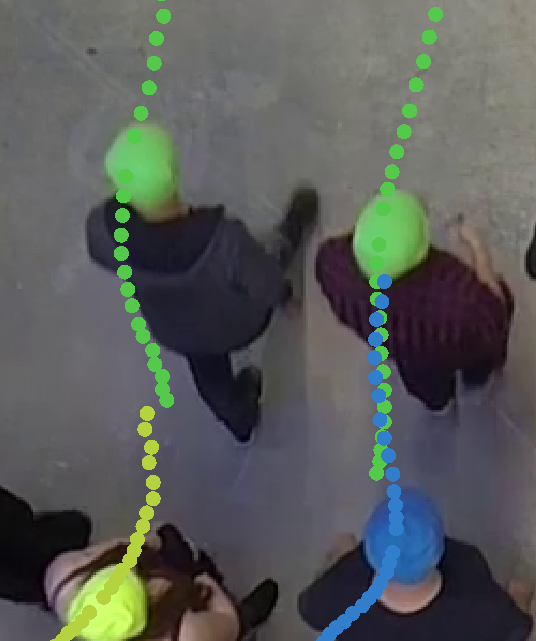
Point visualizations#
Point visualizations only visualize information about the currently displayed frame.
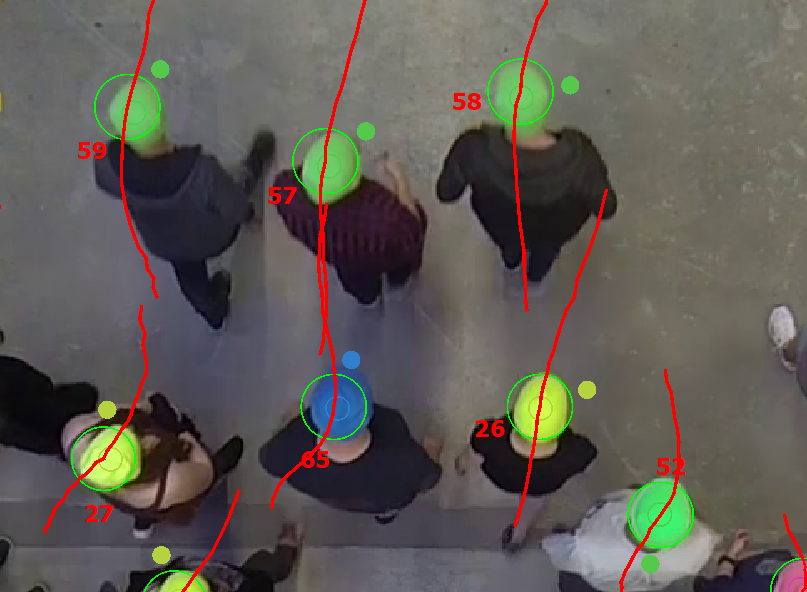
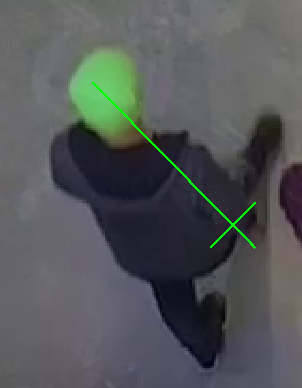
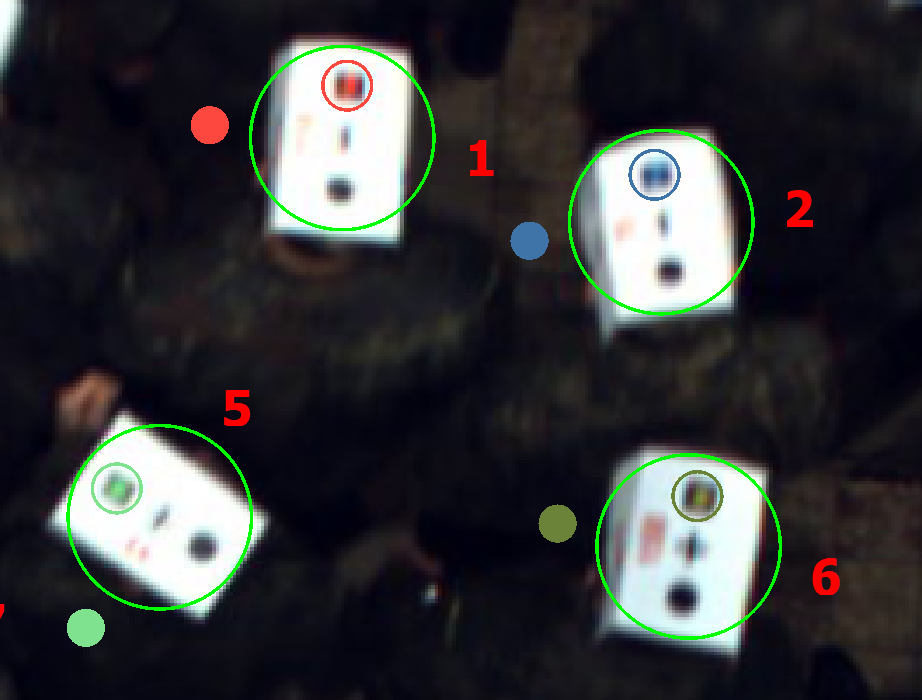
- show current point
Shows the point from the currently displayed frame. The line is colored green, if the point was created as the result of recognition or manually. It is colored blue if the point is the result of tracking only.
Checking
head sizewill set the size of the point heuristically to the avg. head size of a person.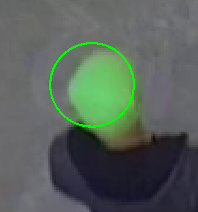
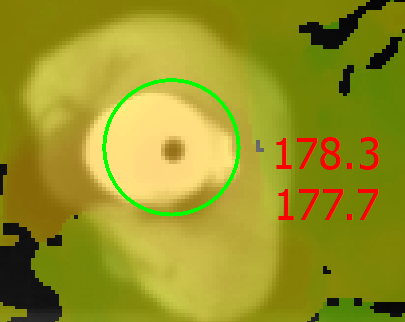
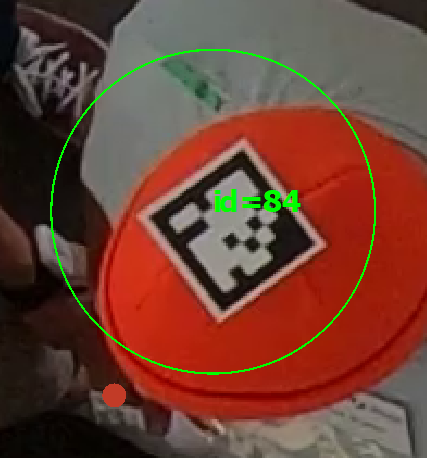
- show height/col. color/marker ID
This option enables two different visualizations. Note that
individualdoes not do anything for the currently recommended markers.A colored blob, next to the person, showing which color is assigned to person.
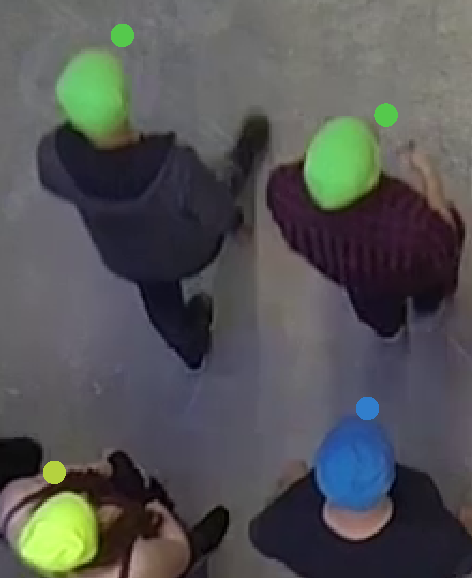
A marker ID from an aruco marker (note that a color blob is visualized as well here)
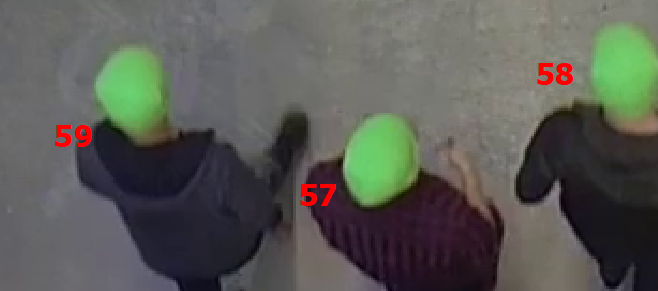
- show number
Shows the PeTrack id of a person
- show ground position
Shows the projection of the head position to the ground
Show only
There are a few options which allow to select people for visualization and consequently disable visualization for all other pedestrians.
- show only visible
This option disables the visualization for all people that are not visible in the current frame. This way, the past trajectories of these pedestrians is not visible and does not clutter up the image. This option does not count as selecting, i.e.
show complete pathandonly selecteddo not change their behavior due to this option.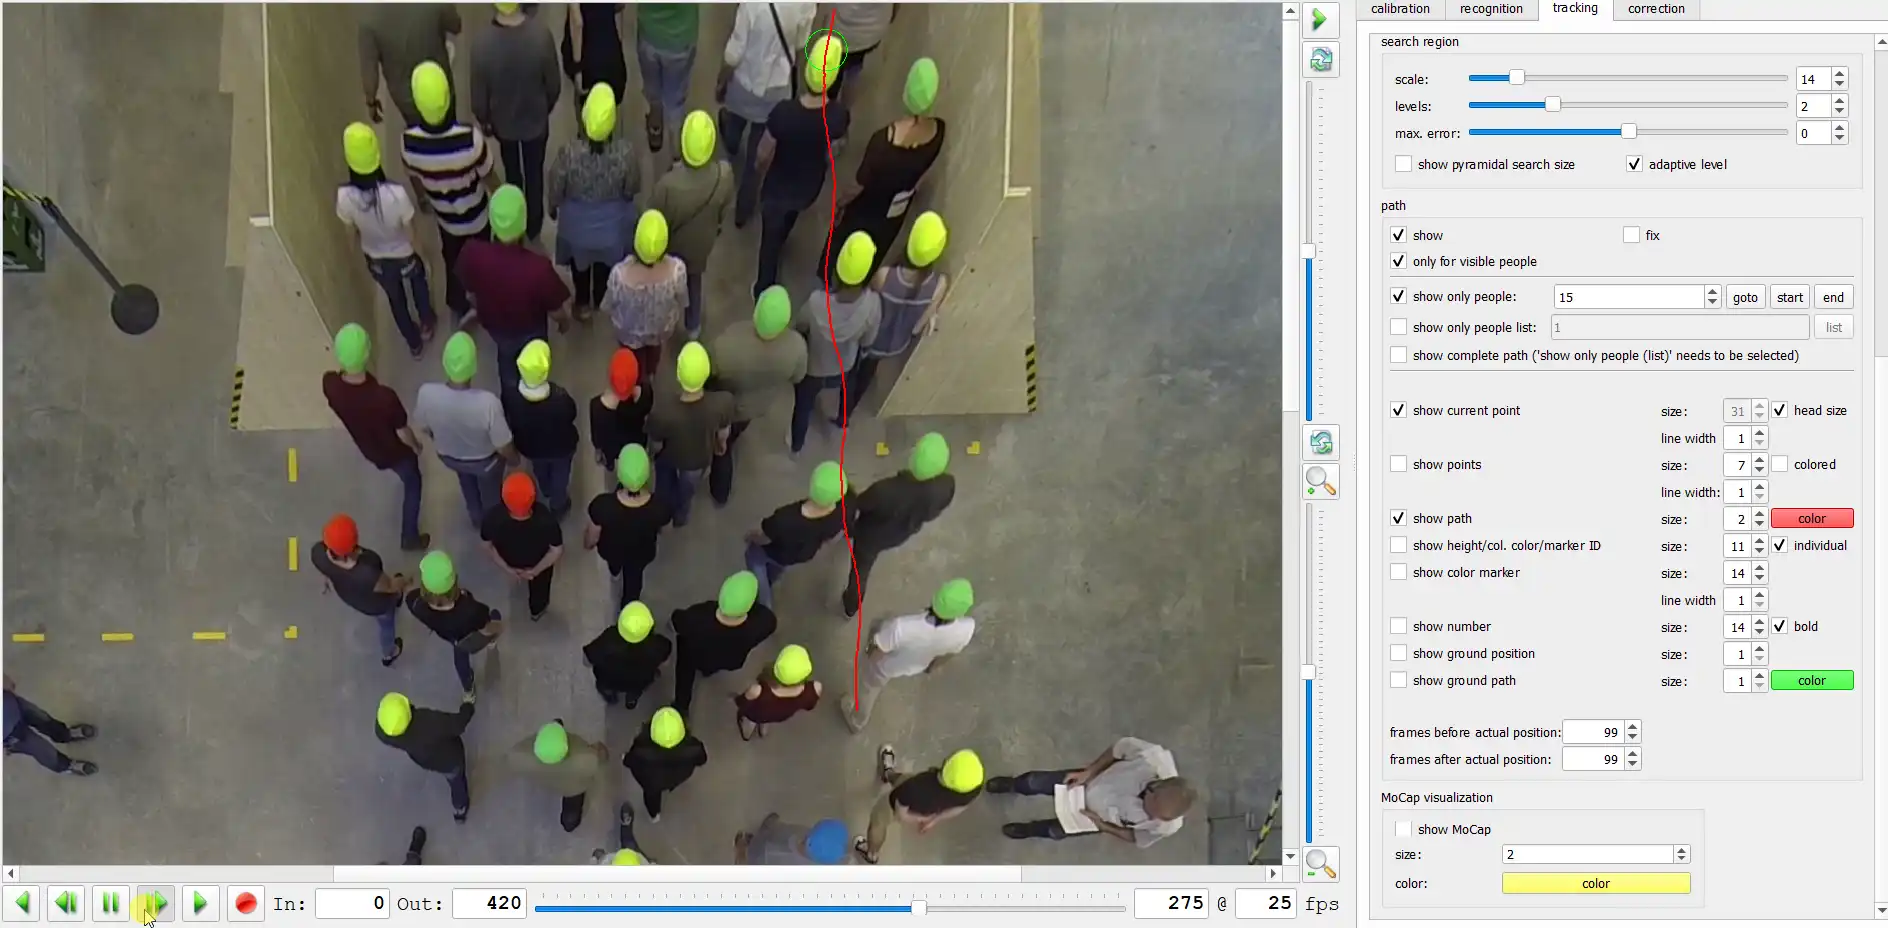
- show only people
This spinbox allows to select a person by their PeTrack id. This person is then the only person visualized. If
only selected(at the top of the tracking tab) is checked for tracking, only this person will get tracked as well.Warning
If
only selectedis not checked, all pedestrians are tracked, even though only one is visualized!The buttons next to the spinbox allow to jump to certain frames.
beginjumps to the first frame of the trajectory,midjumps into the middle of the trajectory andendjumps to the last frame of the trajectory.- show only people list
Visualizes multiple people. One can use a comma-separated list of id’s or a range of id’s written as e.g.
5-9. Only the selected people are visualized anymore and ifonly selectedis checked for tracking, only the selected people are tracked.
Warning
If
only selectedis not checked, all pedestrians are tracked, even though only a few are visualized!
Note
All these options visualize the trajectories between the frames before/after actual position. If you want to see a larger part of the trajectories, you need to change these values, or use show complete path for selected people.
- show complete path
This option changes
show pathto show the complete path (i.e. all past and future frames), if and only if there is an active selection (i.e.show only peopleorshow only people listis active). If there is no active selection, this option does nothing.
Other Options#
This section can be skipped for most people. Here some information on visualization options which are mostly for old markers. Mostly for completeness sake.
- show color marker
Helpful option for markers that include the color as extra point, e.g. the casern marker. The circle drawn by this is colored in the color that was detected and drawn around the colored portion of the marker.
- show height/col. color/marker ID
The height part of this visualization is for stereo cameras, which can measure the height of a person directly. If
individualis selected, two height values are shown. The height measured in the current frame and the avg. height of the all frames. Ifindividualis not selected, only the avg. is shown.